VISIBILITY-GRAPH ASYMMETRY AS A STRUCTURAL INDICATOR OF VOLATILITY CLUSTERING
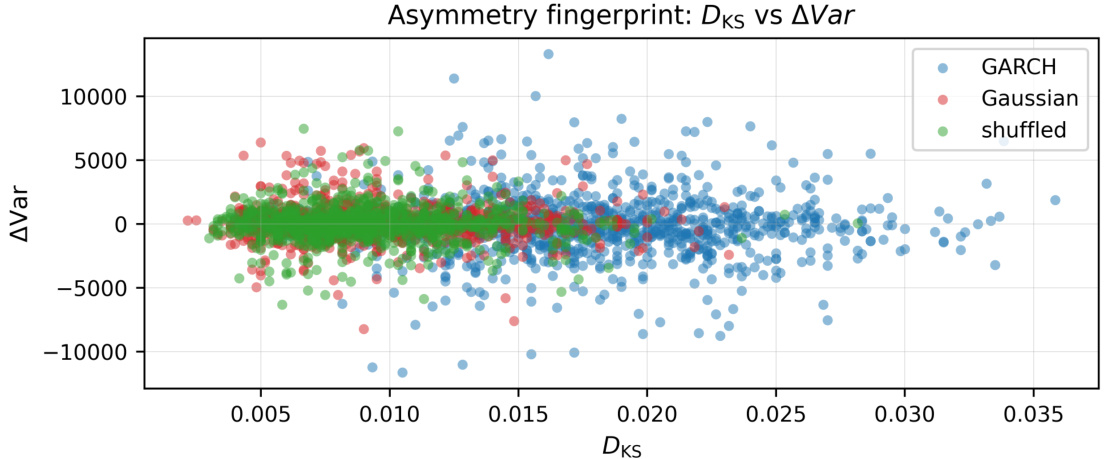
The paper introduces a model-free visibility-graph asymmetry fingerprint computed from maximal forward and backward horizontal-visibility distances on absolute returns, summarized by KS distance, variance difference, entropy difference and extreme-span ratios . The Monte Carlo study shows these geometric features sharply separate clustered GARCH dynamics from i.i.d. Gaussian noise and from shuffled-GARCH controls, with a simple linear classifier achieving ≈90% in-sample accuracy . Applied to daily S&P500 absolute returns, the method reveals a pronounced forward–backward imbalance—most notably a variance difference ΔVar far exceeding simulated GARCH values— and this asymmetry vanishes after shuffling, indicating a temporal (clustering) origin rather than a pure marginal effect .